一、前言

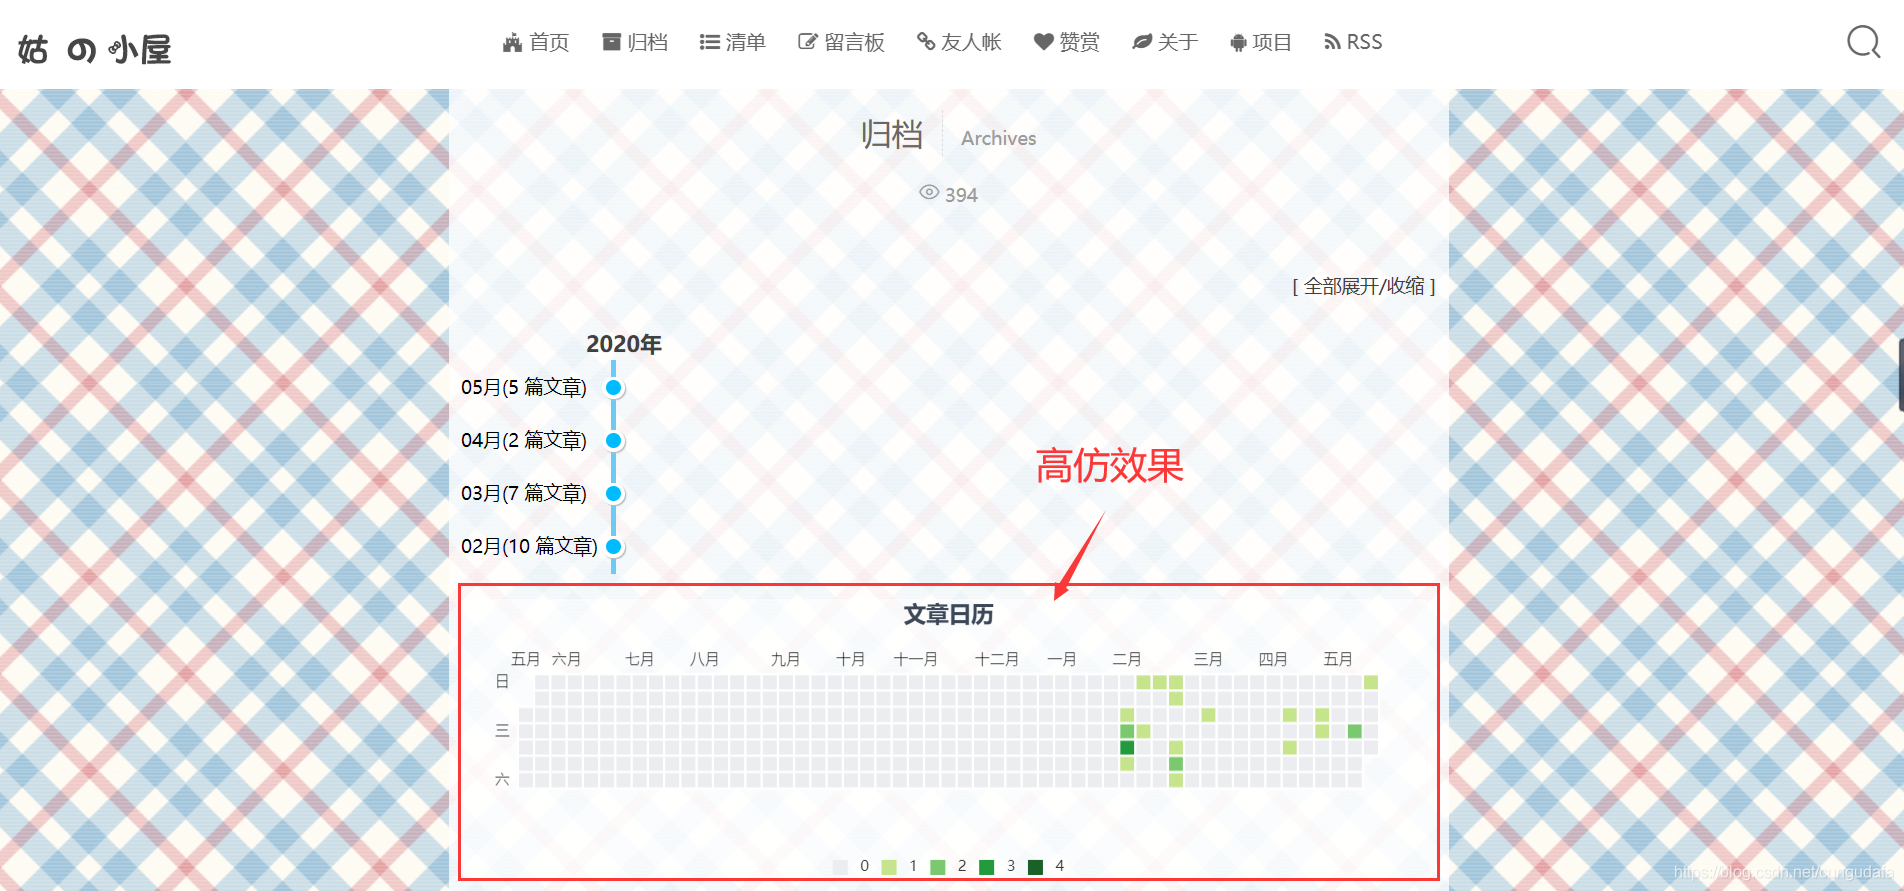
一直想要模仿github和gitee代码提交统计样式,今天在echarts找到了日历图模块的接口,漂亮!

hexo文章achives页面添加显示效果如下:

当然,在sakuraplus主题下已经融合了该功能哦!

二、正文

1.配置

  1. 在主题配置文件themes\sakura\_config.yml下添加:

    # Whether to display post-calender in the `archive` page
    # 设置在归档页面achive中是否显示'文章日历'控件
    postCalendar: true
    123

    如果不想显示,设置为false即可。

  2. 在归档页添加themes\sakura\layout\_widget\post-calendar.ejs

    			<div id="calendar">
    <% if (theme.postCalendar) { %>
    <%- partial('_widget/post-calendar') %>
    <% } %>
    </div>
    12345

    对应了config配置的true和false开关,为true时加载_widget/post-calendar渲染。

  3. 新建日历样式文件themes\sakura\layout\_widget\post-calendar.ejs

复制如下内容:

<div class="container archive-calendar">
<div class="card">
<div id="post-calendar" class="card-content"></div>
</div>
</div>
<style type="text/css">
#post-calendar {
width: 100%;
height: 225px;
margin-top: 20px;
border-radius: 12px;
background-color: rgb(255, 255, 255,0.5);
}
</style>

<script type="text/javascript" src="<%= theme.libs.js.echarts %>"></script>
<script type="text/javascript">
let myChart = echarts.init(document.getElementById('post-calendar'));

<%
// calculate range.
var startDate = moment().subtract(1, 'years');
var endDate = moment();
var rangeArr = '["' + startDate.format('YYYY-MM-DD') + '", "' + endDate.format('YYYY-MM-DD') + '"]';

// post and count map.
var dateMap = new Map();
site.posts.forEach(function (post) {
var date = post.date.format('YYYY-MM-DD');
var count = dateMap.get(date);
dateMap.set(date, count == null || count == undefined ? 1 : count + 1);
});

// loop the data for the current year, generating the number of post per day
var i = 0;
var datePosts = '[';
var dayTime = 3600 * 24 * 1000;
for (var time = startDate; time <= endDate; time += dayTime) {
var date = moment(time).format('YYYY-MM-DD');
datePosts = (i === 0 ? datePosts + '["' : datePosts + ', ["') + date + '", ' +
(dateMap.has(date) ? dateMap.get(date) : 0) + ']';
i++;
}
datePosts += ']'; %>

let option = {
title: {
top: 0,
text: '文章日历',
left: 'center',
textStyle: {
color: '#3C4858'
}
},
tooltip: {
padding: 10,
backgroundColor: '#555',
borderColor: '#777',
borderWidth: 1,
formatter: function (obj) {
var value = obj.value;
return '<div style="font-size: 14px;">' + value[0] + ':' + value[1] + '</div>';
}
},
visualMap: {
show: true,
showLabel: true,
categories: [0, 1, 2, 3, 4],
calculable: true,
inRange: {
symbol: 'rect',
color: ['#ebedf0', '#c6e48b', '#7bc96f', '#239a3b', '#196127']
},
itemWidth: 12,
itemHeight: 12,
orient: 'horizontal',
left: 'center',
bottom: 0
},
calendar: [{
left: 'center',
range: <%- rangeArr %>,
cellSize: [13, 13],
splitLine: {
show: false
},
itemStyle: {
width: '1.88679%',
height: '15px',
color: '#EEEEEE',
borderColor: '#FFF',
borderWidth: 2
},
yearLabel: {
show: false
},
monthLabel: {
nameMap: 'cn',
fontWeight: 'lighter',
fontSize: 12
},
dayLabel: {
show: true,
formatter: '{start} 1st',
fontWeight: 'lighter',
nameMap: ['日',' ',' ','三',' ',' ','六',],
fontSize: 12
}
}],
series: [{
type: 'heatmap',
coordinateSystem: 'calendar',
calendarIndex: 0,
data: <%- datePosts %>
}]

};

myChart.setOption(option);
</script>

123456789101112131415161718192021222324252627282930313233343536373839404142434445464748495051525354555657585960616263646566676869707172737475767778798081828384858687888990919293949596979899100101102103104105106107108109110111112113114115116117118119120

注意文章第16排:<%= theme.libs.js.echarts %>"

  • 如果是其他主题,修改为

    https://cdn.jsdelivr.net/gh/cungudafa/cdn/js/echarts.min.js
    1
  • 如果是sakuraplus直接在config添加:

    echarts: https://cdn.jsdelivr.net/gh/cungudafa/cdn/js/echarts.min.js
    1


    现在hexo调试应该可以出现日历图了。

2.流程说明

具体说一下echarts如何显示日历图:

  1. 读取hexo文章信息(date)
  2. echarts基本使用方法

(1)读取date

步骤:

  1. 获得去年今日到今年今日所有天数
  2. 获得文章发布时间,存入dateMap
  3. 根据Map做一个次数的累计,存入datePosts
  4. 将关键信息写入options

参考于:hexo-theme-matery主题 ,这款主题对echarts用得淋漓尽致,漂亮!

(2)日历显示规则

echarts的食用方法:引入js,初始化到容器,在options写入配置。
本次日历模板使用文档:官网,对于options的配置一定参考官方使用文档。
(标题、提示语、注释都如下图)

具体说说日历的构成:(根据官网和gitee样式,高仿效果)

3.优化

当然本文只是对gitee高仿日历图,

如果你对样式还不满意,请结合官网修改。

单个元素:

多种样式: